Capstone Project
Overview of my Capstone Project that was centered around tracking data of Twitch Streamers utilizing a real-time data feed.
For my Capstone Project, I wanted to do something that was not only a culmination of my learning thus far, but also challenging. Which would also offer me the opportunity to learn even more. I spent a good amount of time thinking about what to do. After a couple scrapped ideas, I eventually settled on the idea of creating a three-tier application meant to track statistics related to Twitch streamers.
Why Twitch?
I am a frequent user of the platform, typically having it on in the background or on another monitor while I work on other items, like school work. I was always amazed by the sheer volume of data & events that occur on Twitch. So, I felt it would be a great platform to base my Capstone Project around.
The Plan
The plan for my Capstone Project was to build a three-tier architecture that would be able to…
Tier 1 (Presentation) - Provide a user interface for anyone with access to a web browser and internet connection be able to query and view the data & information related to the tracked streamers from Twitch.
Tier 2 (Middleware) - Provide the core processing aspects of this project. While also acting as the intermediary between the database (Backend) and website (Presentation / Front End). Examples of the core processing is the REST API that handles the requests from the website to retrieve data from the backend database. As well as the real-time feed of data from the tracked Twitch Streamers that is eventually stored in the database for future use and retrieval.
Tier 3 (Backend) - Provide storage of all the data and information collected from the Tier 2 portion. Such as subscriptions, bits, timeouts, bans, deleted messages, and more!
Tier 1
For the first tier, I utilized a Node.js web application framework called Express. And then just created normal website pages with HTML, CSS, and JavaScript.
Tier 2
For the second tier, there were two core parts.
- Data collection from Twitch channels.
This portion utilized a JavaScript package called tmi.js that is able to connect and interact with Twitch Chat using Node.js. This package not only gives us the ability to connect to the Twitch Chat, but also hundreds of different events that occur within those chats. Such as subscriptions, bits, timeouts, bans, gifted subs, raids, deleted messages, and more! And it does all of this extremely fast. This is what I commonly refer to as a real-time feed to the tracked Twitch Streamers. I would estimate that during peak times, there could be anywhere from 50,000 to 100,000 individual events per minute. (Depending on how many channels are tracked) However, I only configured it to save information related to certain events, not everything.
- Retrieval of data from database to front-end website.
For this portion, I decided to just expand on my use of the web application framework from the first tier called Express. And then utilized the npm package called mysql to allow Express to be able to talk with the database to provide the REST API that is called whenever a user loads one of the web pages for the website.
Tier 3
For the third tier, I utilized MySQL to handle the backend database that stores the data that was useful from the real-time feed.
The Website
Index / Home
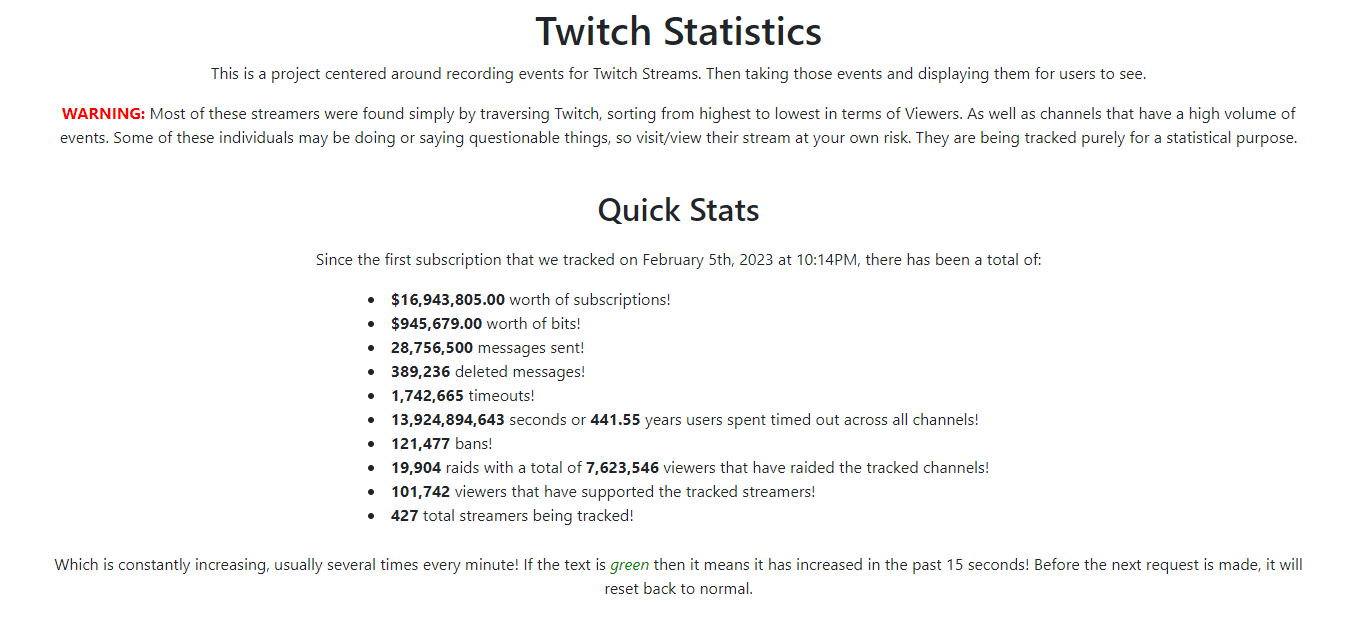
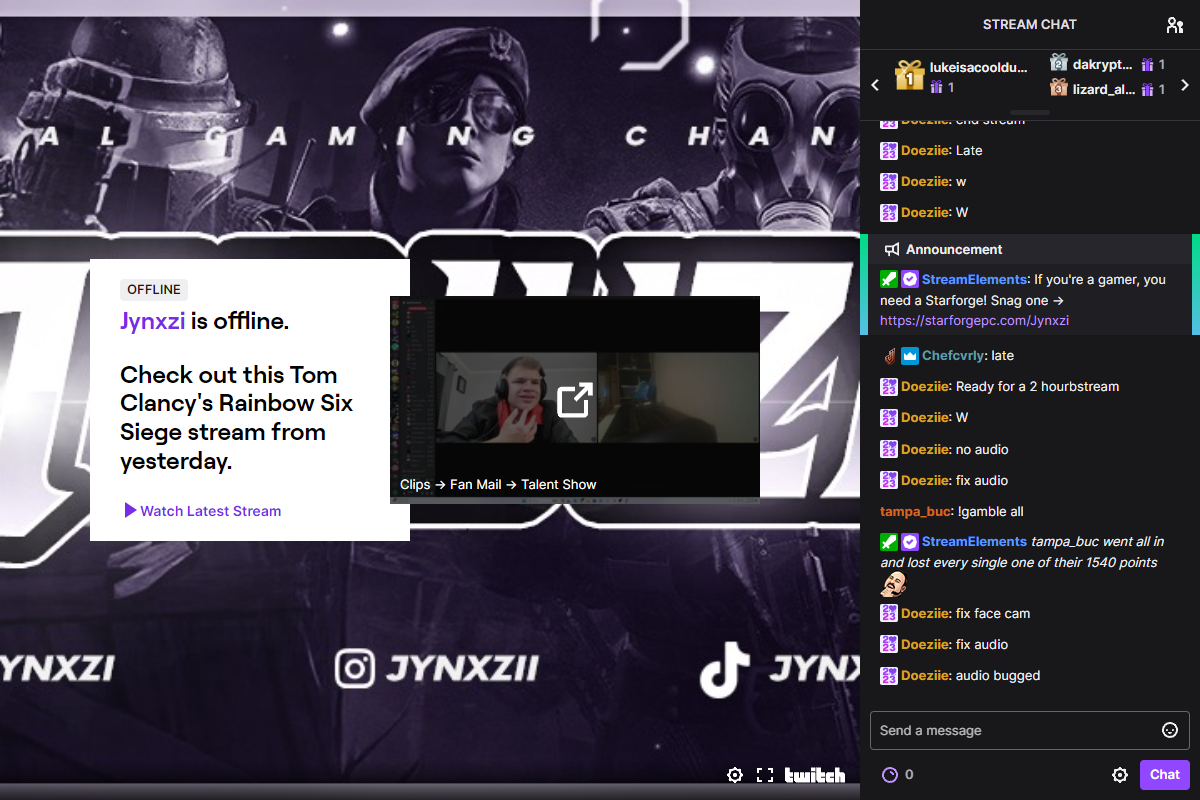
Screenshot of the website’s homepage.
What you immediately see after you load the website. This is where you would first be greeted with the Quick Stats. Which was basically an overview of every bit of data that was collected during the Capstone Project’s collection period. (February 5th, 2023 - May 2, 2023).
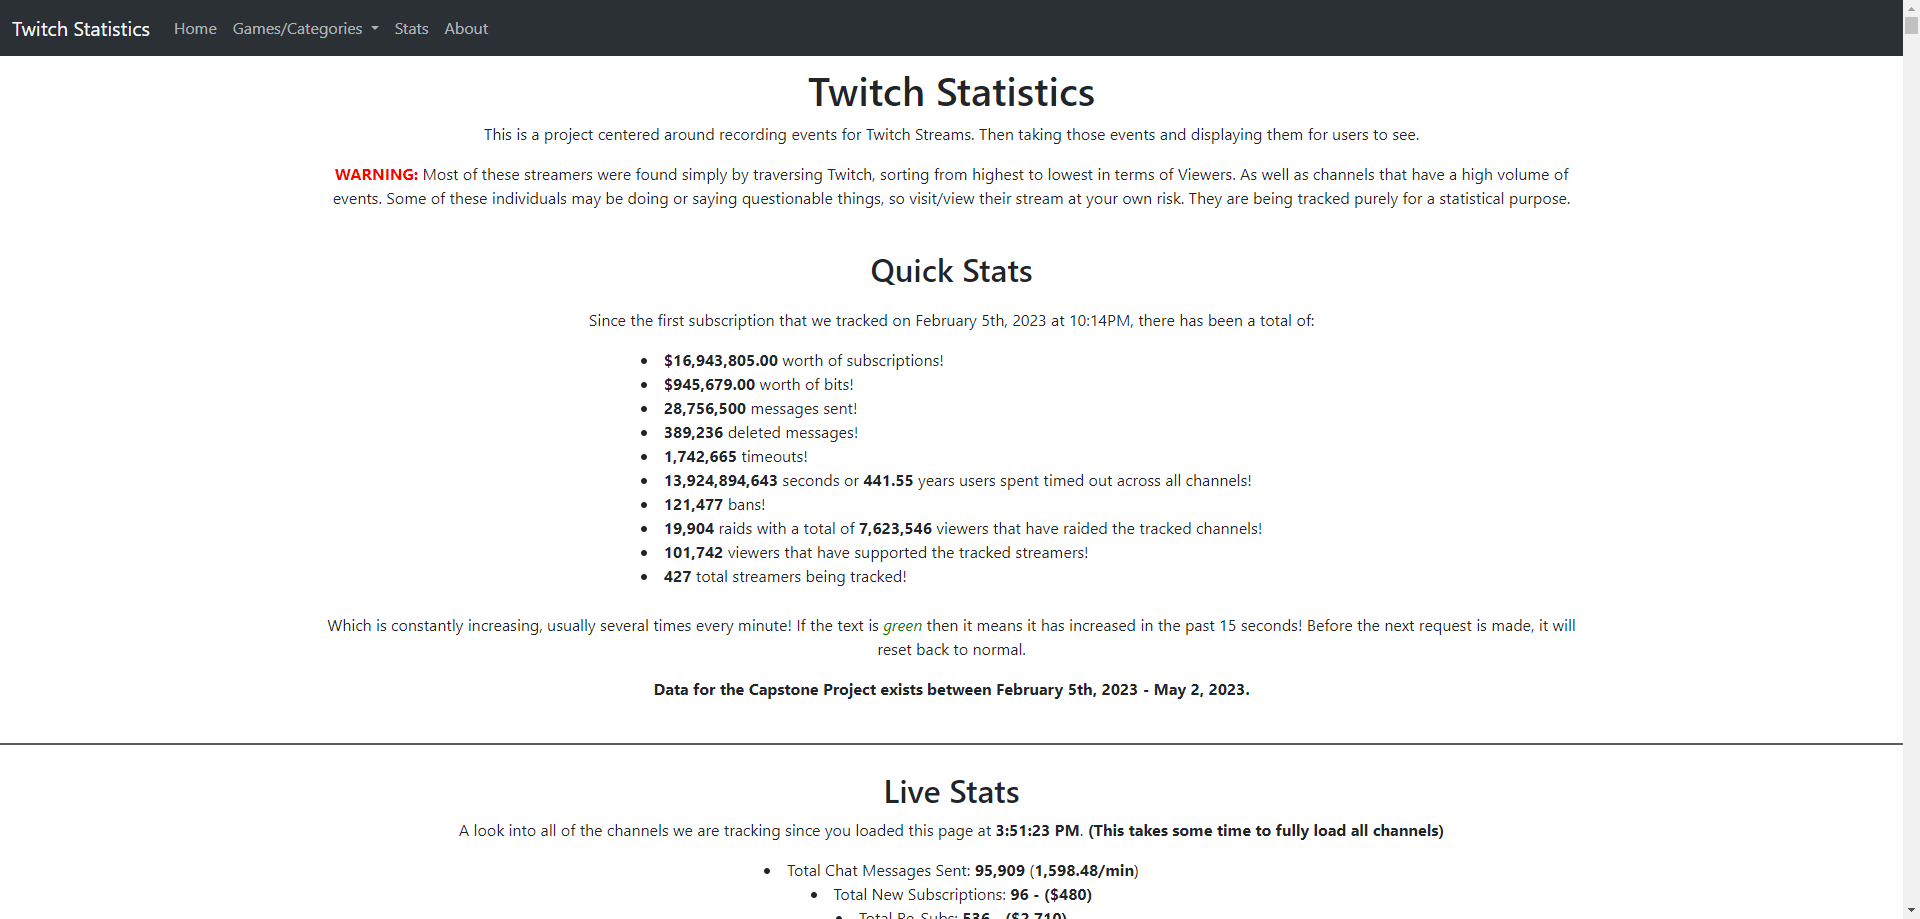
After the Quick Stats, you are shown a live demonstration of the backend processing that is done in the Tier 2 stage for collecting data from Twitch. Each time someone loads the index page, it also loads this in the background. It includes all of the same streamers that is being tracked normally. Since it loads in the background, it takes some time to fully connect to all 427 Twitch Streamers.
Live Stats changing in real time for the tracked channels.
As you scroll down the index, you would eventually see all of the different games and categories, and the respective streamers for each. This only included the streamers and categories that was being tracked through this Capstone Project.
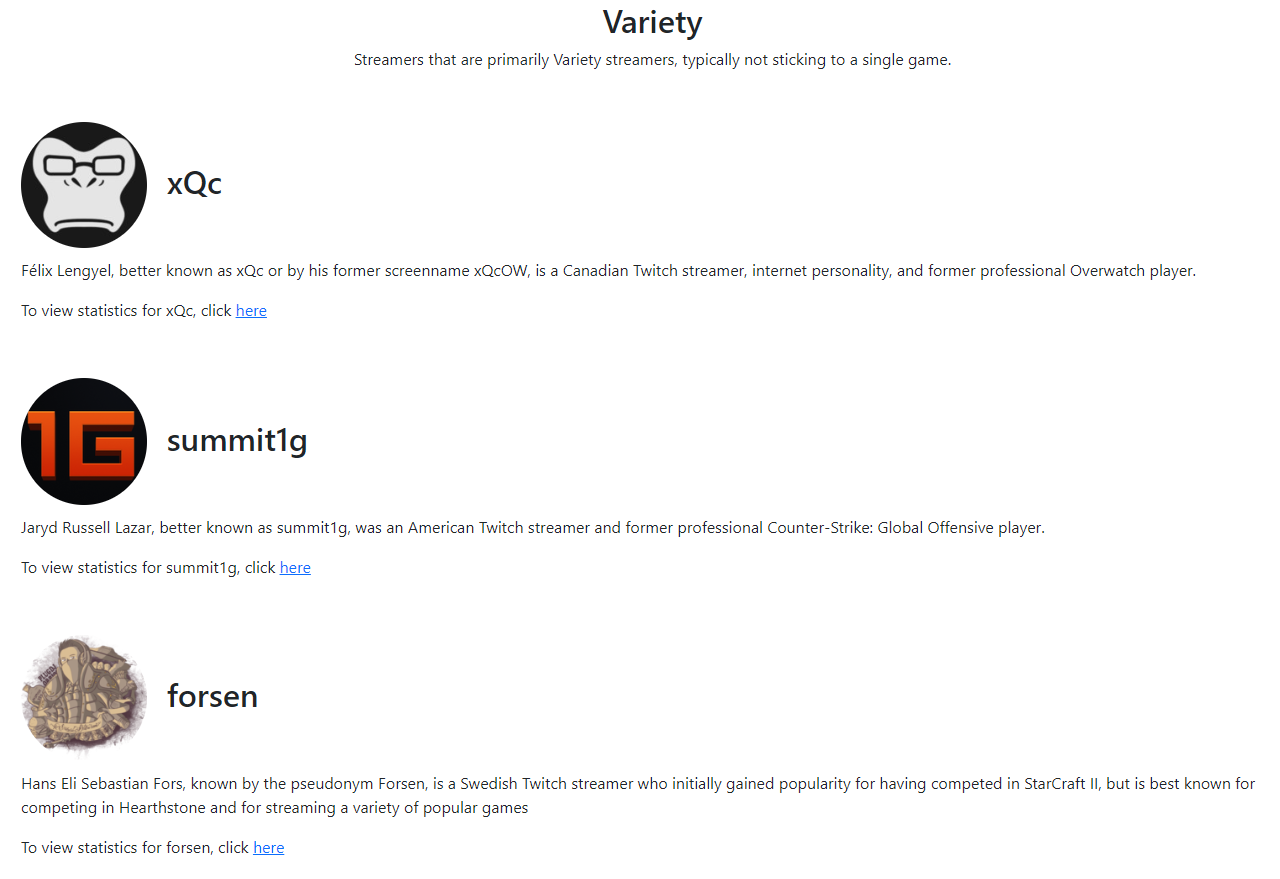
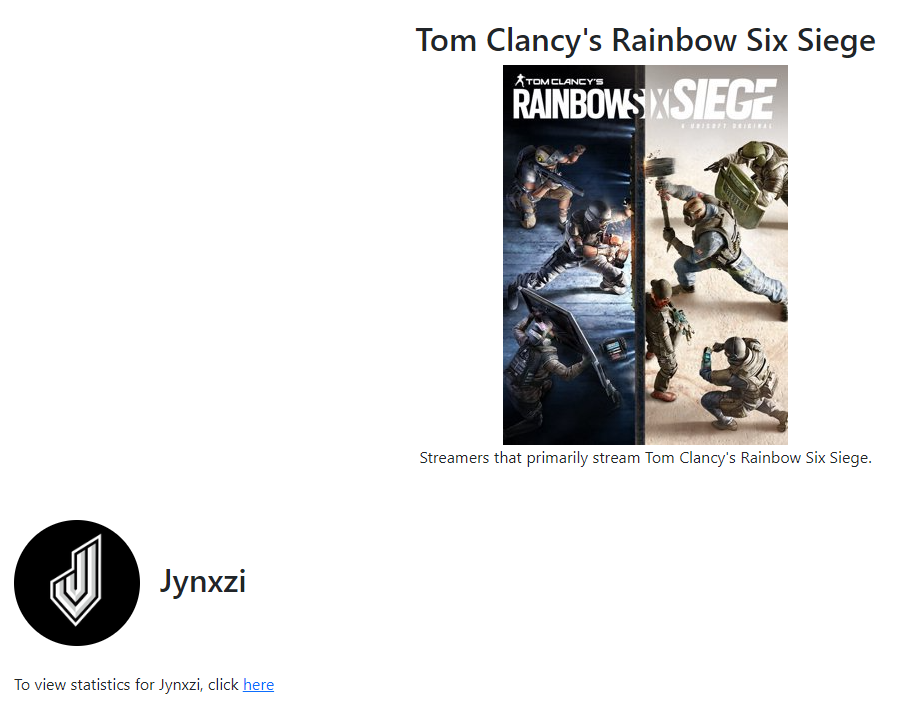
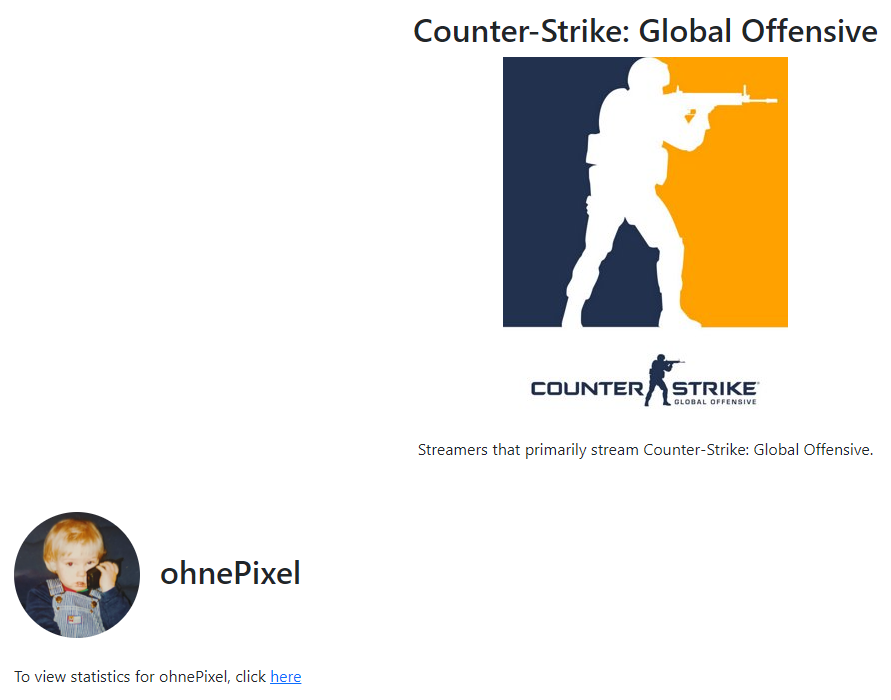
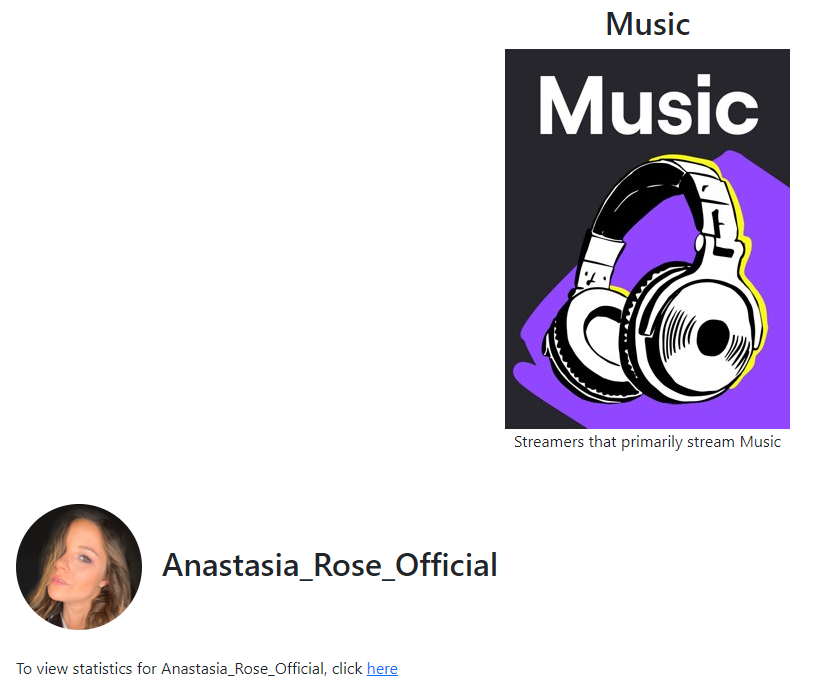
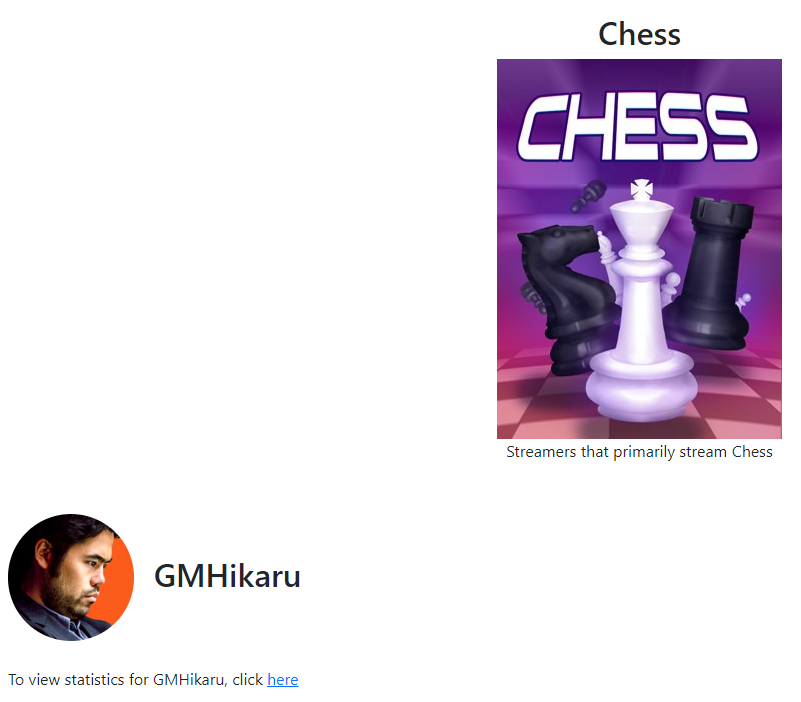
As seen in the above images, each tracked streamer had a link that would redirect the viewer to a separate webpage that queried the database for data collected for that specific streamer. This link would redirect them to what I referred to as a channel view.
I also provided some additional functionality for users to be able to quickly jump to the different Games & Categories that they are looking for. As well as after scrolling down so far, they will be shown a button that automatically scrolls them back up to the top of the page. I found this necessary improvement with how big the Index / Home page is.
Channels
After finding the specific streamer that you are looking to see data collected for, you select the hyperlink that redirects you to a channel specific webpage.
Just like with the index page, you are greeted with Quick Stats that is specific for that streamer.
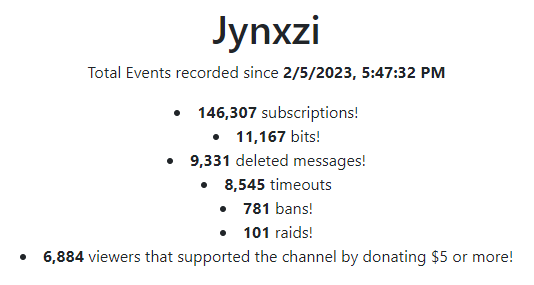
Quick Stats for Jynxzi
Below the Quick Stats, the channel page is broken down into several different sections to highlight the different event types that are collected for the streamer. And in some sections, it provides charts and displays that the user is able to interact with to manipulate the data even further and visualize it all better.
Subscription Events
There are four different tiers of subscriptions that individuals can utilize. Starting from the cheapest and gradually increasing in price. The first one is a Tier 1 subscription, which costs $4.99 before taxes. The second is a Tier 2 subscription, which costs $9.99 before taxes. The third is a Tier 3 subscription, which costs $24.99 before taxes. The last remaining one, Tier 4, which was not available until Amazon’s acquisition of Twitch. The fourth tier is typically referred to as a “Prime Sub”, due to the fact that it is a “free” monthly subscription to all subscribers of Amazon Prime. If an individual has Amazon Prime, they have this free monthly subscription to do whatever they please with it. It is equivalent to a Tier 1 subscription in terms of amount the content creator receive.
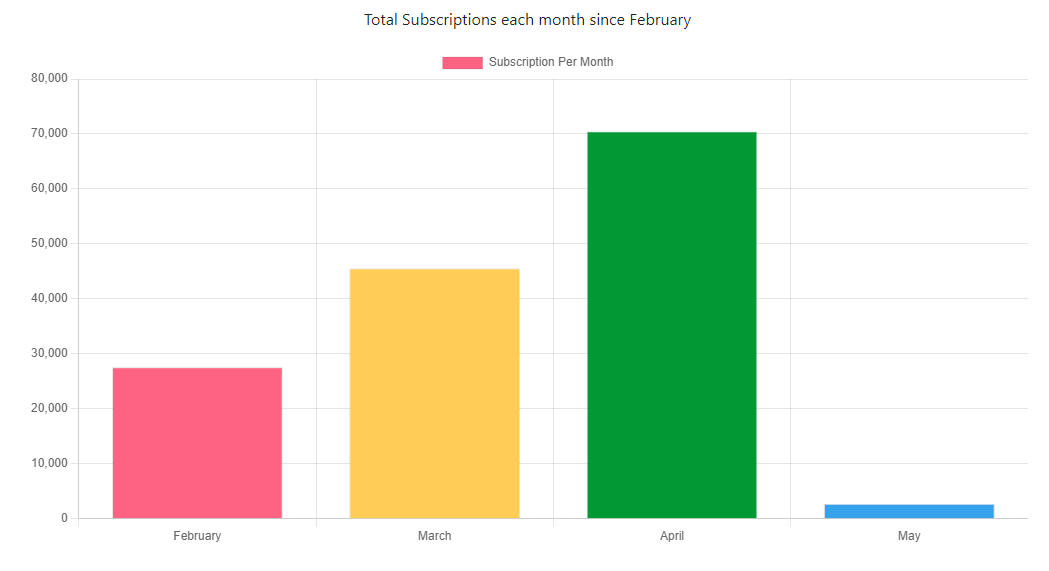
During the live version of this, there was also information related to the past thirty days of data collected for Subscriptions. It was a rolling period, instead of a set period of time such as only events in February. However, this was not shown since this is no longer operation and it is only using the data already stored.
Re-Subscription Events
These events occur whenever someone subscribes that has previously been subscribed at some point or is currently subscribed and their subscription has renewed for a month.
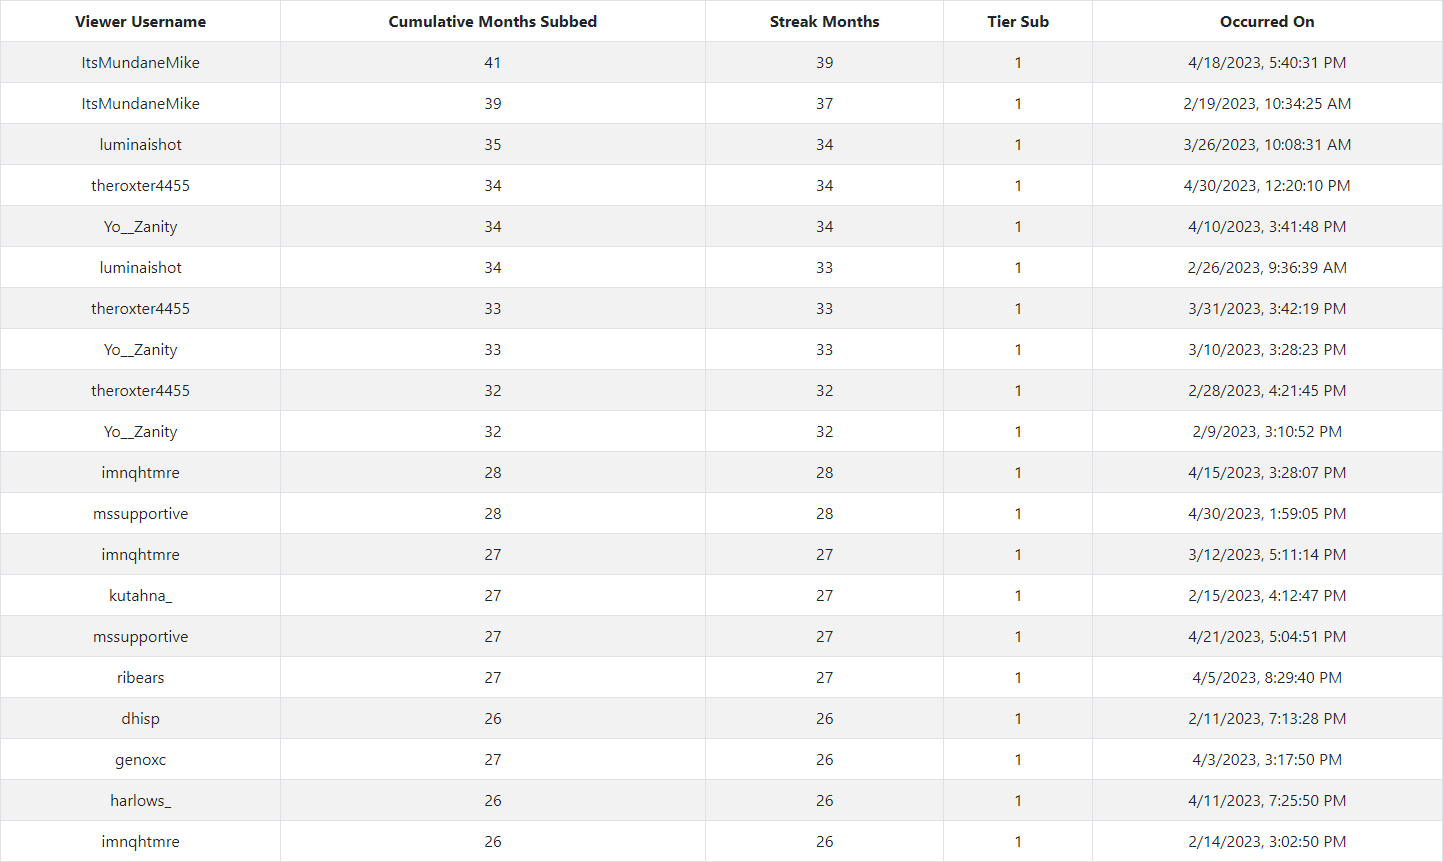
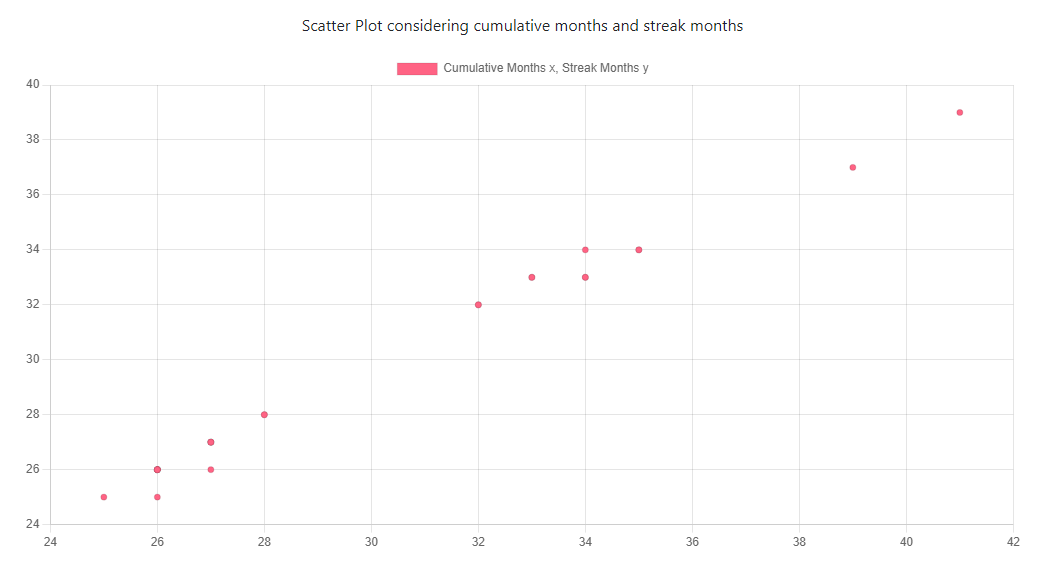
Re-Subscription Events ordered by the total continuous months subscribed.
The highlighting part of this section is being able to see how many cumulative months and how many months someone has subscribed in a row (streak).
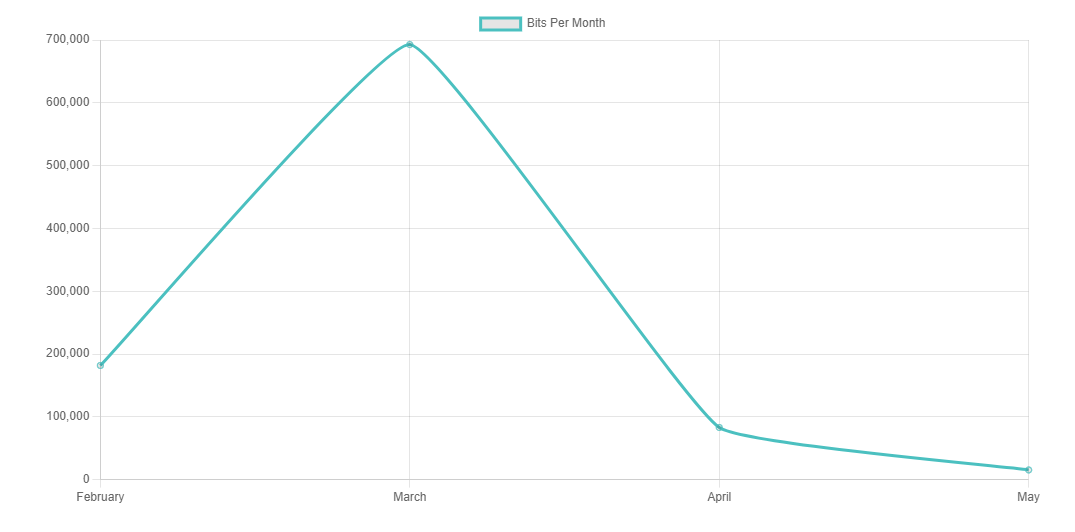
Bit Events
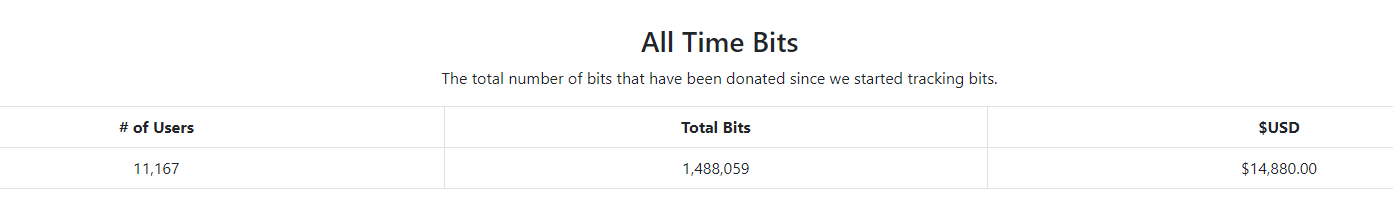
Bits are another method for viewers to support streamers. 1 Bit is equivalent to 1 cent USD.
Viewers
This section gives the user a list of viewers of that specific channel that have financially contributed to the streamer. Whether that be through gifted subscriptions or bits. This is something that I created by adding some functionality to be able to perform this.
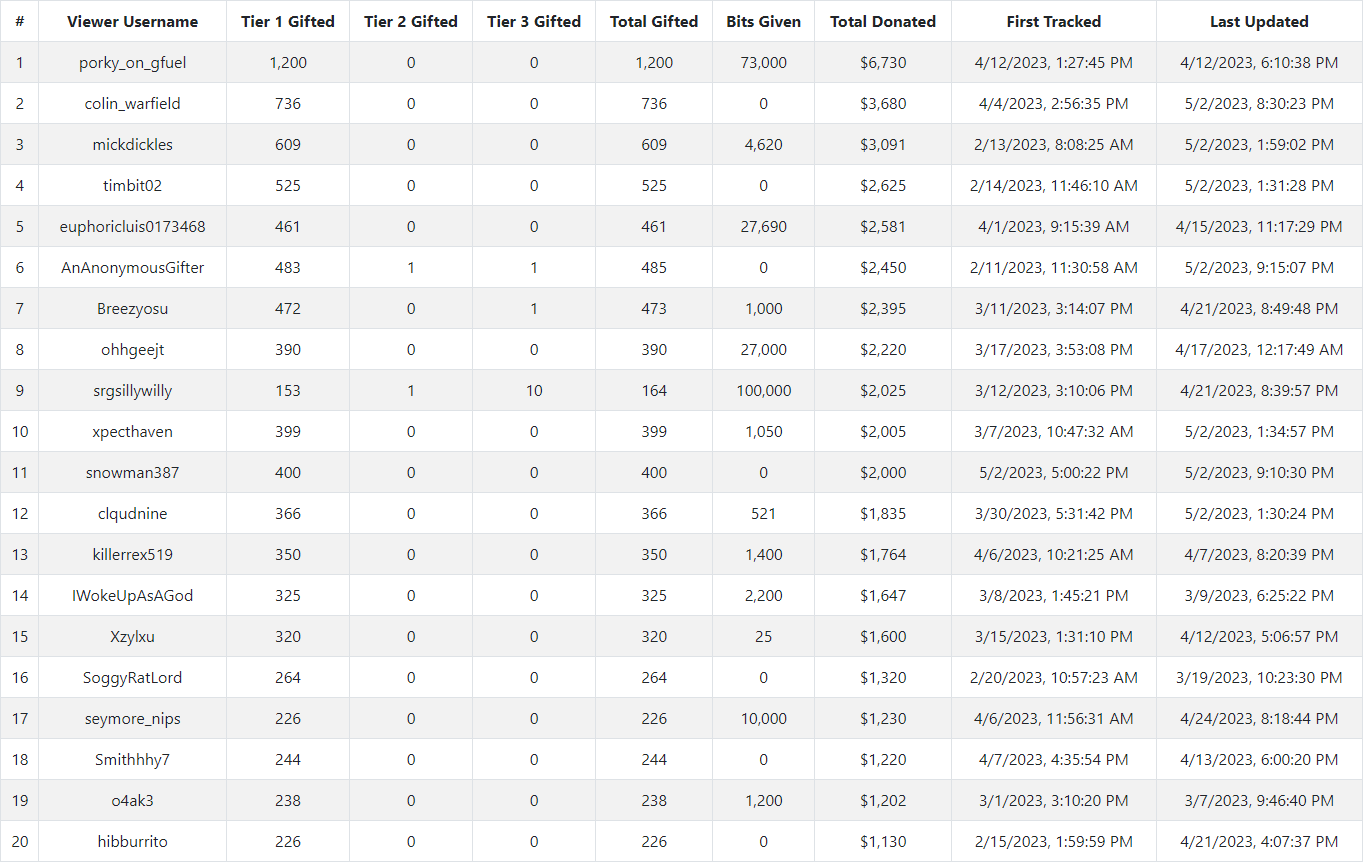
Viewers for the channel sorted by the Total Donated.
I found this to be a very worthwhile thing to implement. I believe it is really interesting to be able to see an overview of contributions by a user for a specific channel. And sometimes shocking how much has been contributed. Just from the above image, more than $6,000 dollars was sent to the streamer in less than six hours.
Mod-Action Events
These are events that occur when a moderation of a channel performs the action of either timing out or banning a user from the channel.

As seen in the above image, this one channel has timed out it’s users for a total duration of 8.18 years or 258,149,371 seconds.
Viewer Raids
Raids are events that occur when one channel is ending their live stream and decides to send their viewers to another channel.
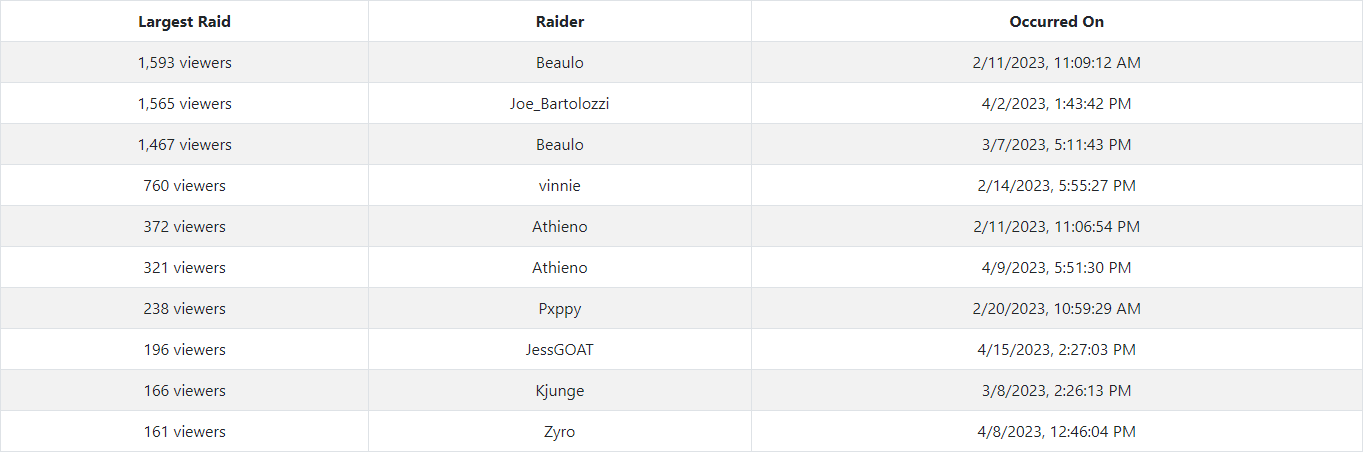
Viewer Raids sorted by total viewers that took part in the raid.
Which results in us being able to track what channel sends their viewers to the specific receiving channel, and how many viewers were part of the raid.
Deleted Messages
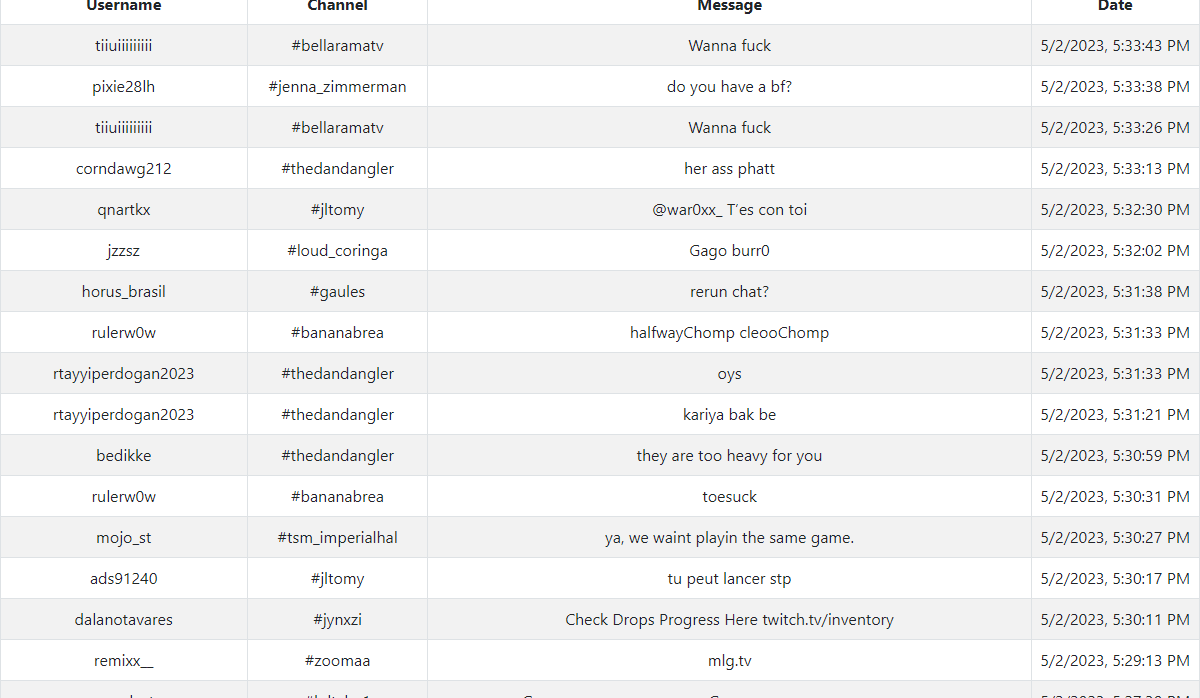
One of the largest parts of Twitch’s live streaming platform is the chat. This enables viewers to be able to not only talk to the streamer, but also other viewers. As expected with the internet, there might be some trolls or individuals that are posting messages that is not allowed on Twitch in general, or in that specific channel.
Just out of curiosity, I added the ability for it to save information on the deleted messages as well. It is more of a double edged sword - some of the messages are interesting to read, some are normal messages that were just timed out by accident, while others are really bad and disgusting.
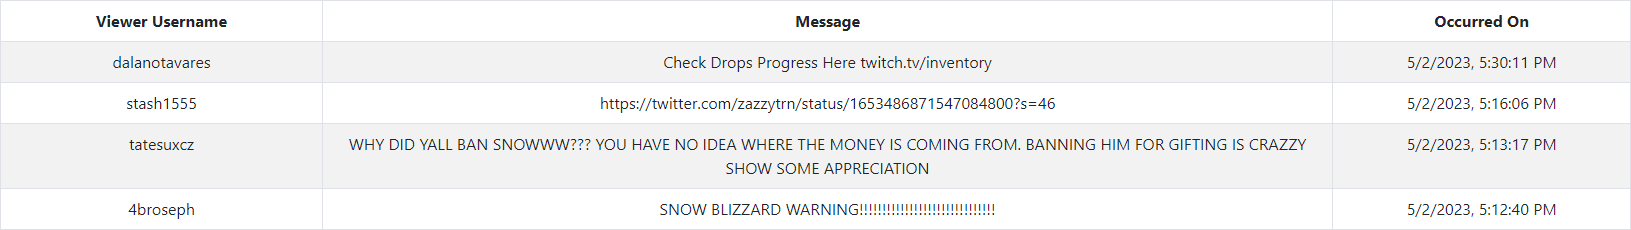
Messages that deleted from the channel’s chat.
Live Stream
The last remaining portion of the channel webpage, is just a embedded version of the live stream and chat. This wasn’t really necessary, but I thought it added to the page and might be interesting for individuals that have not used Twitch before. Especially when some of these channels have 50,000+ people watching them and lots of messages being sent at certain times. It’s sort of like an additional visualization for them to see it for themselves in a live fashion.
Stats
This section contained several different parts that I created to be able to give the user an overall look into statistics for the entire project. Instead of just a look into statistics for one channel. It aggregates data from all channels as it was added to the database. It also provides some more context compared to the Quick Stats on the home page.
Last 1,000 Deleted Messages
This showed the last 1,000 deleted messages that was recorded in the database from the tracked channels. This is just a glimpse of some of the weird messages that are sent in channels.
Messages that were deleted in the tracked channels.
Top 1,000 Viewers by Total Donated
This queries the database for the top 1,000 users and orders it by the total amount of money that the viewer has donated for that specific channel.
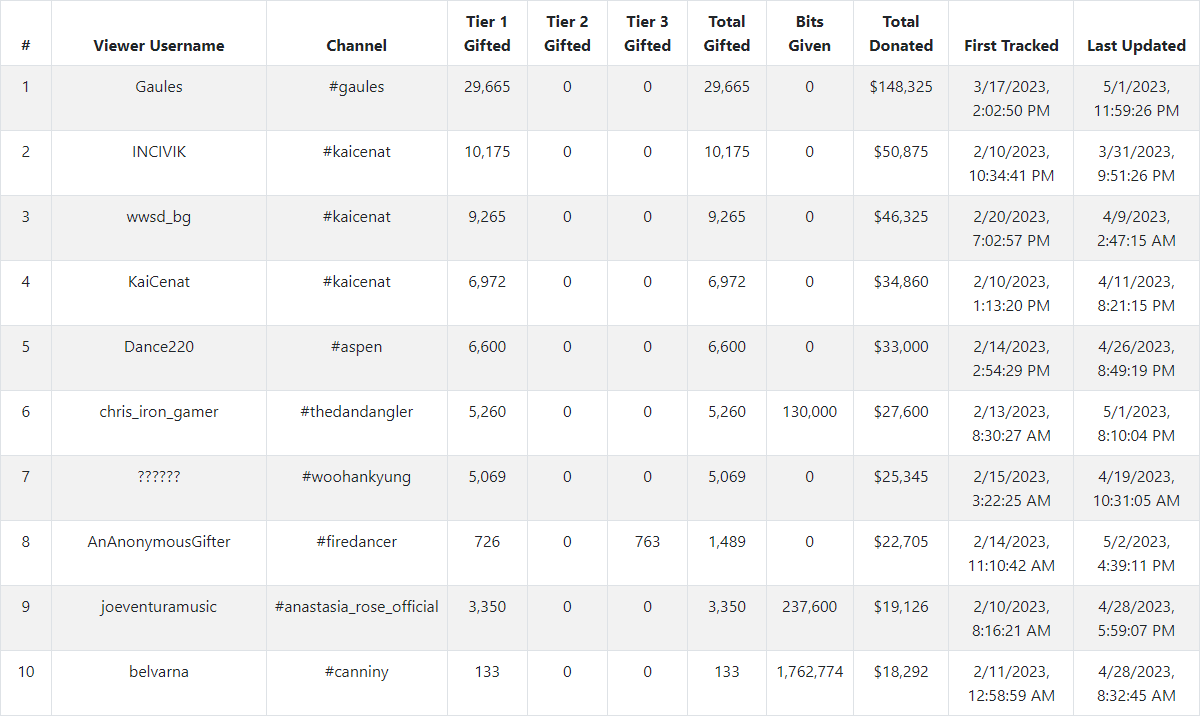
Top 10 Viewers by Total Donated
Viewers That Supported Multiple Channels
This is more for getting some insight into what other channels a viewer is watching and financially supporting (if any).
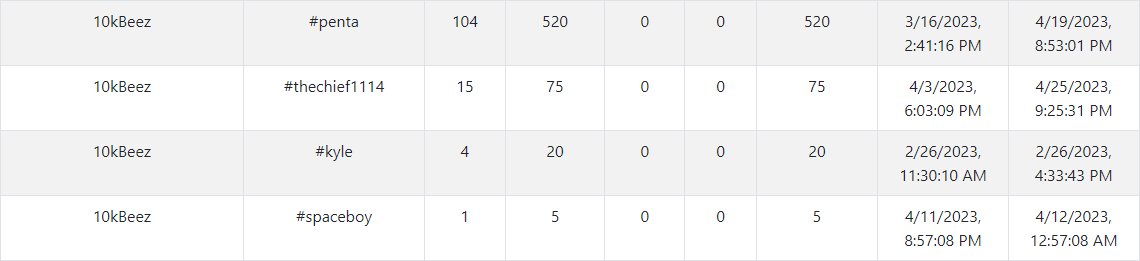
User that supported four different GTA V Streamers for varying amounts of money. (520, 75, 20, 5)
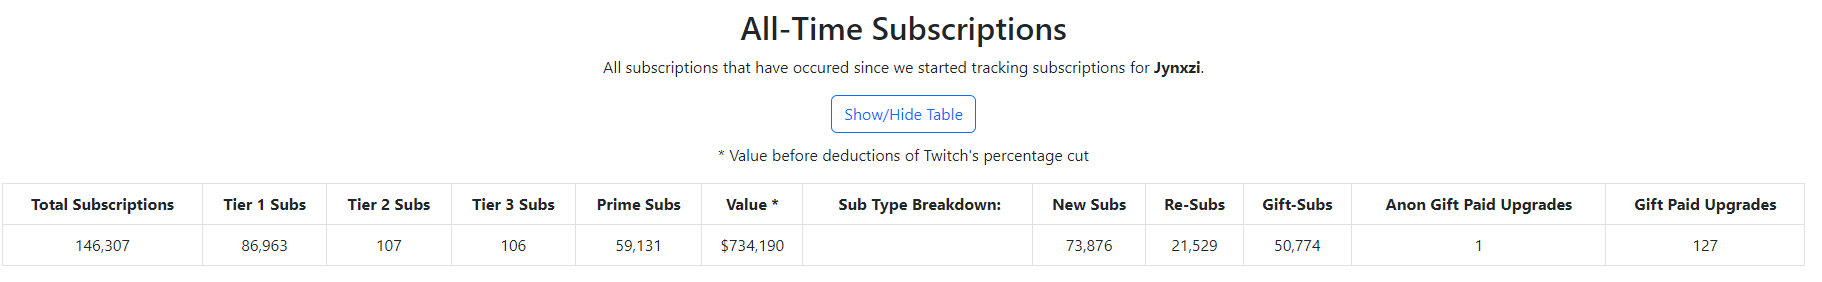
Subscriptions
This provides insight into data for subscriptions across all channels. I created some similar charts that were seen on the channel page.
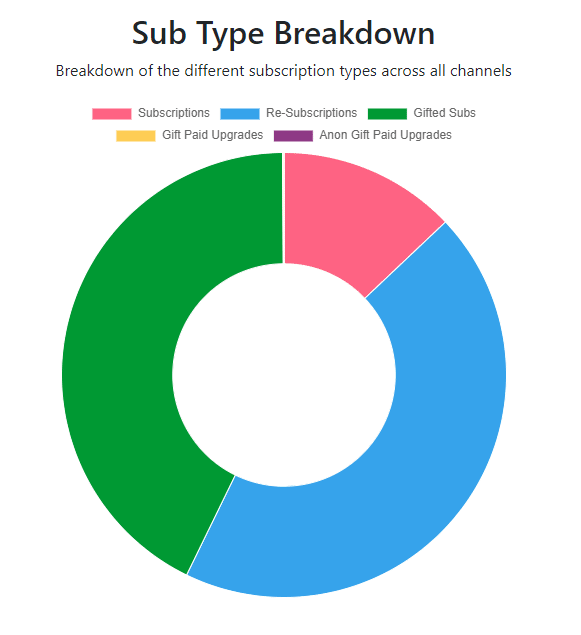
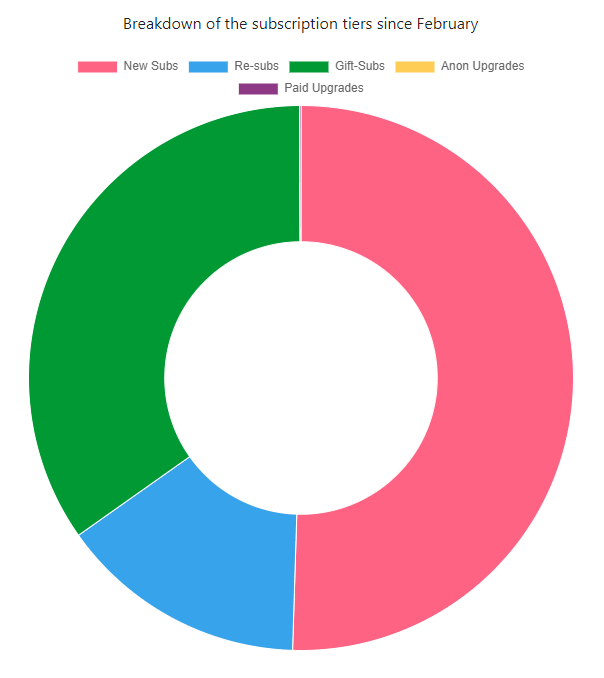
Sub type breakdown (Subscriptions vs Re-Subscriptions vs Gifted Subscriptions vs Gifted Paid Upgrades vs Anonymous Gifted Paid Upgrades)
As briefly shown above, the project had the overall subscription breakdown of:
- 430,117 Subscriptions
- 1,473,004 Re-Subscriptions
- 1,419,584 Gifted Subscriptions
- 3,467 Gifted Paid Upgrades
- 69 Anonymous Gifted Paid Upgrades
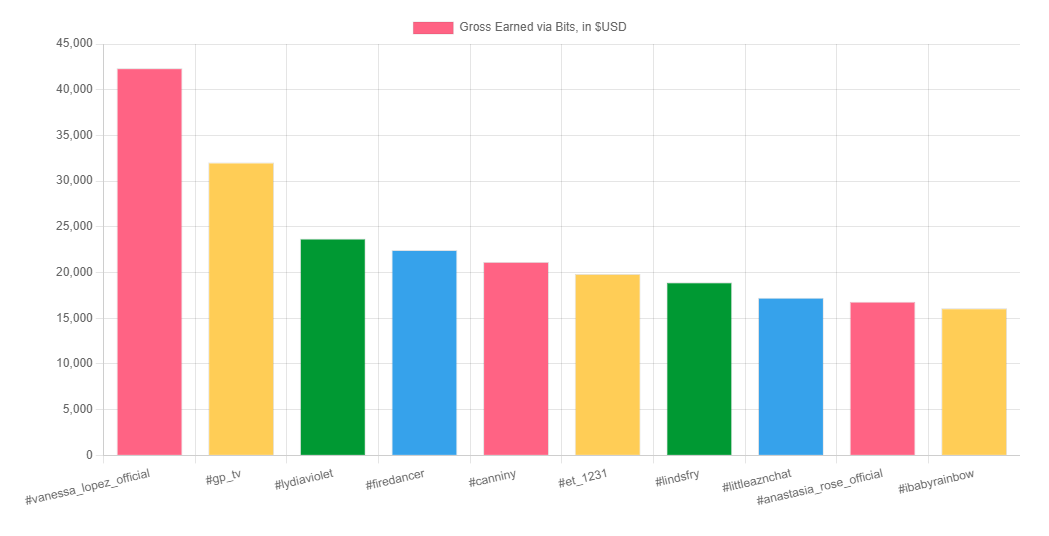
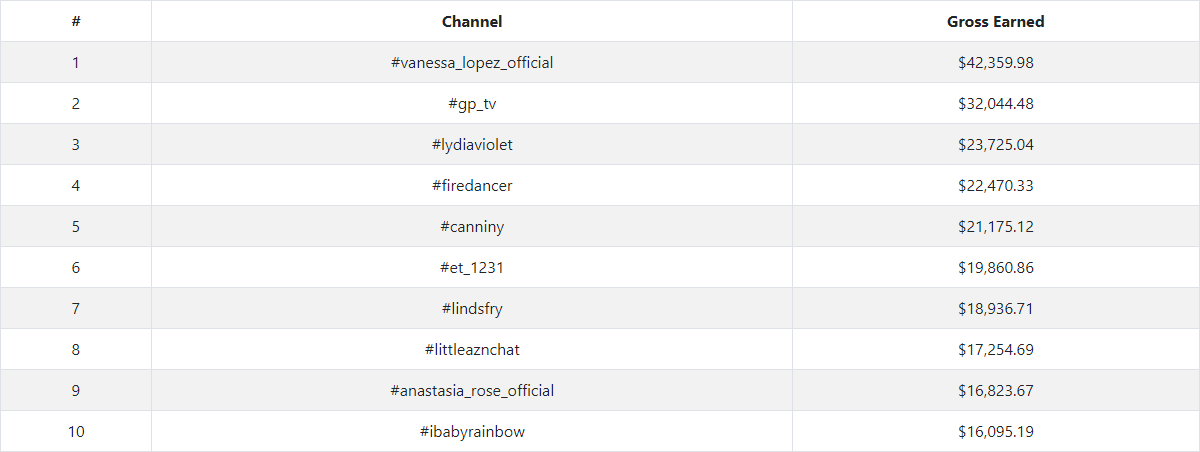
I then went towards an individual channel perspective - I created a query that calculates the Gross Earned (in USD) from subscriptions for each channel. Then I ordered them from the top to bottom, and displayed the top 10.
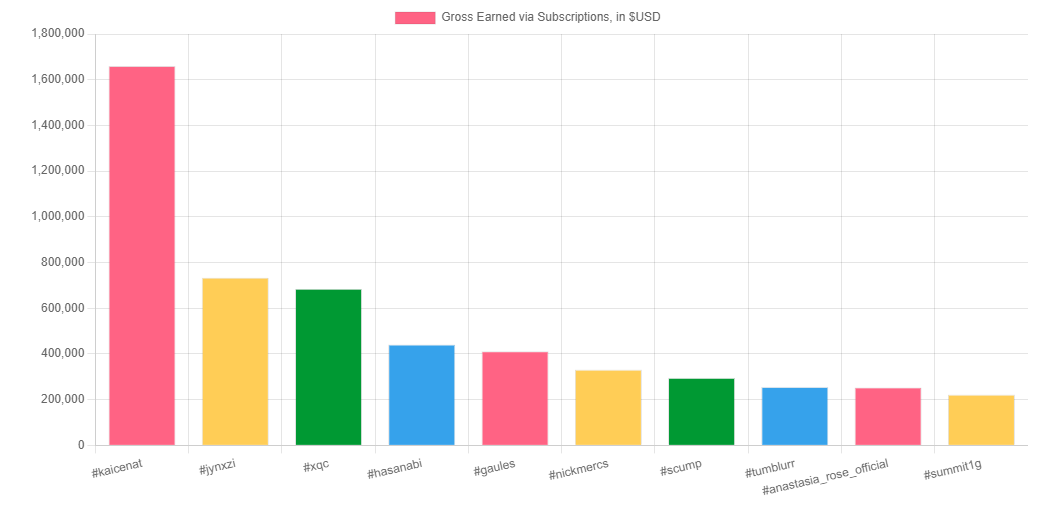
Top 10 Gross Earning Channels by Subscriptions
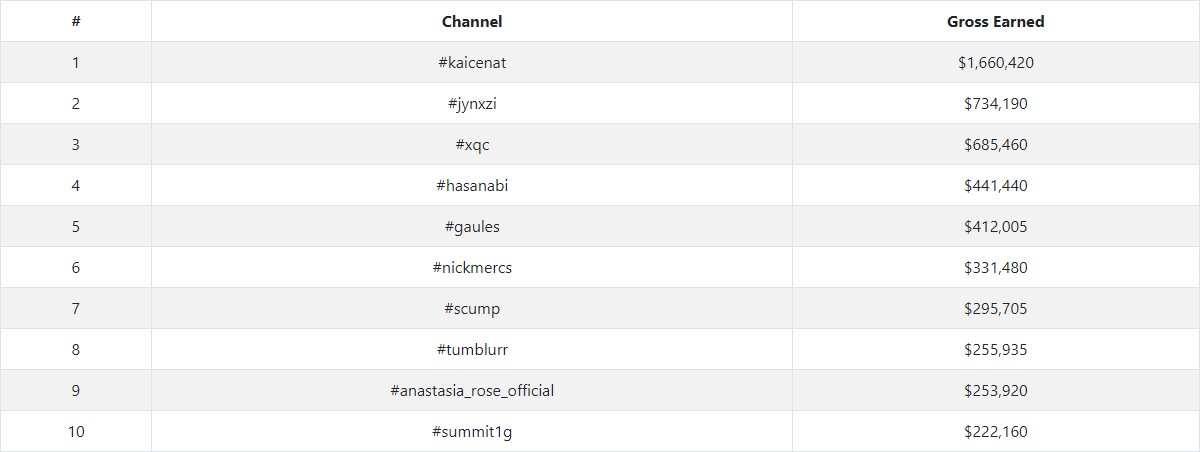
Top 10 Gross Earning Channels by Subscriptions (Table View)
And then for the remaining section was something that I created to try and pull some further meaning / conclusion out of the data. I categorized each tracked channel into a category of Male or Female. I then provided comparisons between the two groups based on their combined Gross Earned.
After categorizing the streamers, we were tracking 132 male streamers, and 284 female streamers. (Excluding individuals that did not fall into these two categories)
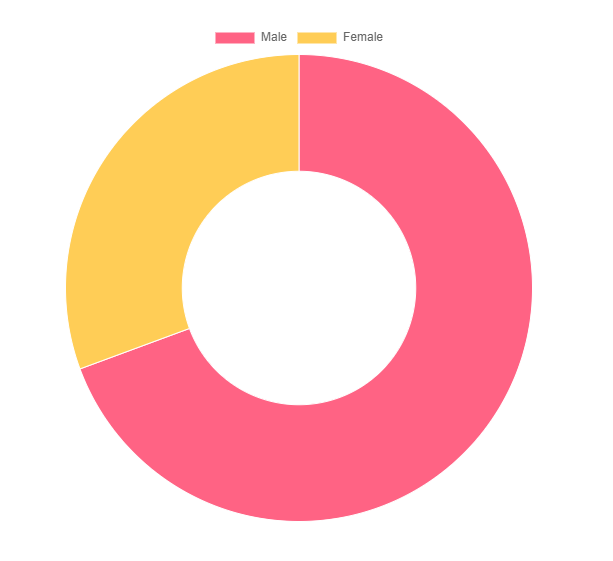
Gross Earned via Subscriptions. Male vs Females.
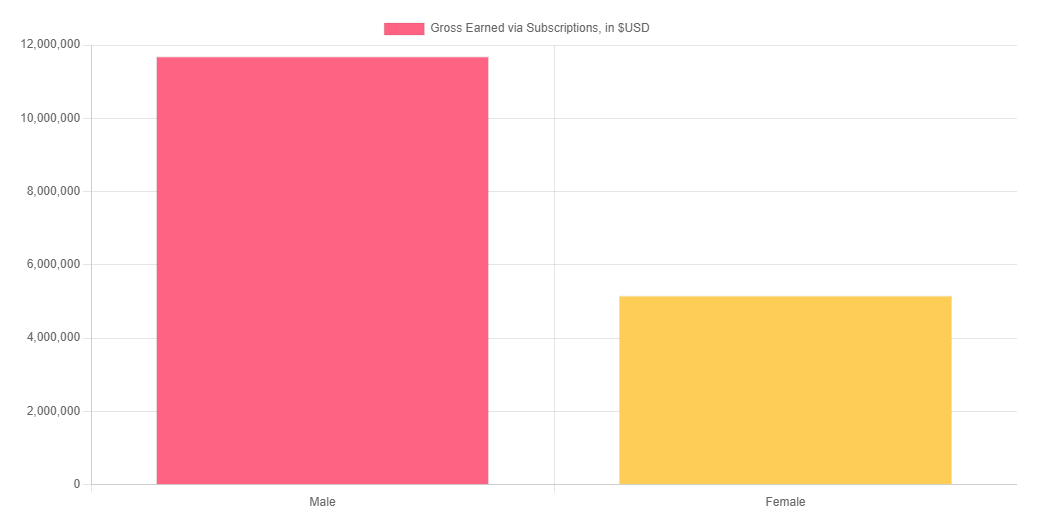
Gross Earned via Subscriptions. Male vs Females.
- $11,692,815 worth of subscriptions for Male streamers.
- $5,163,285 worth of subscriptions for Female streamers.
Bits
Similar to the Subscriptions stat page, I also did the Gross Earned for each individual streamer, as well as a Male vs Female comparison.
Top 10 Gross Earning Channels by Bits
Top 10 Gross Earning Channels by Bits
And then for the comparison between Male vs Female streamers:
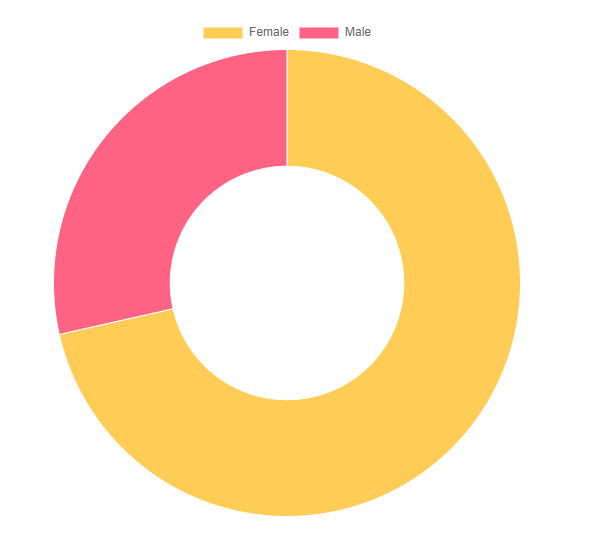
Gross Earned via Bits. Male vs Females.
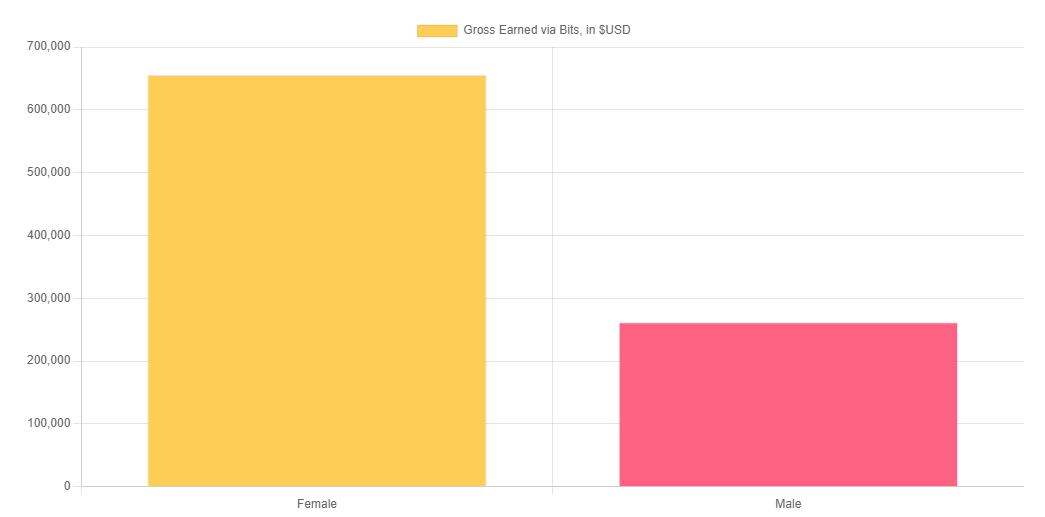
Gross Earned via Bits. Male vs Females.
- $655,424.58 worth of Bits for Female streamers.
- $261,672.53 worth of Bits for Male streamers.
About
This section just provided some minor information about the project and it’s purpose. The following two paragraphs is the content that was on the page which I wrote while I was working on this project:
“This project is centered around my Capstone Project (Spring Semester, 2023). I have watched Twitch streamers for several years now, and I typically have it playing it the background while I am working on school. So I am already fairly familiar with how everything works, but something I was always intrigued by was the pure volume of data and events that occur every minute. So… I ended up building a system that can fill my curiosity. The system tracks more than four hundred streamers, some that I watch, and some that I just found that I believed would provide a lot of events. At the occurrence of each event, it will record it in a database, which will allow users to retrieve the information from their browser.
During the time that I’ve been working on this Capstone Project, I have been amazed the entire time. Tracking more than $7,500,000 worth of subscriptions and bits within around a month in a half since first tracking data… with only a little more than 400 streamers being tracked. Billions of seconds worth of time users spent timed out in channels… Thousands of viewers that are financially supporting the streamers, some donating thousands of dollars to one streamer… Being able to notice some trends, such as Male streamers typically receive more subscriptions, while Female streamers receive more bits donations. I would argue this isn’t just a project centered around building the system and architecture, but also the data analytics side with the amount of data that is being sent and tracked.”
It also provided some statistics related to the project thanks to wakatime which was able to track time spent in Visual Studio Code. The total time that was tracked was 149 hours, 15 minutes.
![]()
It doesn’t include time spent outside of Visual Studio Code, so all together it would probably be around 1.5 to 2 times this amount of time.
Lastly, I mentioned some milestones for the Capstone Project that I noticed during the development and creation:
-
System / Server configured and begun listening for events on 02/05/2023 at 10:15 PM
-
We hit 100,000 Subscription Events on 2/11/2023 at 10:45PM. After six days and 32 minutes of us listening for events. The first recorded subscription event was a re-sub to xQc, and the 100,000th was a re-sub to moistcr1tikal. The 500,000th subscription was to KaiCenat
-
More than $3,5000,000 worth of subscriptions and bits have been donated to the tracked streamers in less than twenty-three days since we started tracking. (2/28/2023)
-
More than $7,500,000 worth of subscriptions and bits have been donated to the tracked streamers, after a little more than two weeks since the previous milestone. (~3/16/2023)
-
More than $10,000,000 worth of subscriptions, and $575,000 worth of bits have been donated to the tracked streamers. Less than two months since starting this project. (3/31/2023) - This results in an average of $24,850 to each of the 426 streamers we are tracking. In less than two months. And this is just with 426 streamers, when there are hundreds of thousands of streamers that we could track.
I didn’t track all of the milestones, but it includes some early ones.
Late Addition to Data Tracking
About a week before I turned off the infrastructure that was responsible for maintaining this capstone project, I implemented a new feature for tracking the total messages sent across all channels.
The chat messages were coming in so fast, that to prevent completely destroying the system, I had to create some logic within the code to batch so many messages up before updating the database.
This was fully implemented on 4/24/2023, and the system was turned off about a week later. So it was not running the full time, but in that short time span, there was ~28,756,500 messages sent.
Overall Data Tracked
As mentioned in the Quick Stats section, all of this data was tracked between February 5th, 2023 at 10:14 PM - May 2nd, 2023.
- $16,943,805.00 worth of subscriptions!
- $945,679.00 worth of bits!
- 28,756,500 messages sent!
- 389,236 deleted messages!
- 1,742,665 timeouts!
- 13,924,894,643 seconds or 441.55 years user spent timed out across all channels!
- 121,477 bans!
- 19,904 raids with a total of 7,623,546 viewers that have raided the tracked channels/streamers!
- 101,742 viewers that have supported the tracked streamers!
- 427 total streamers being tracked
Each section of this involves a different type of event that we tracked for data. Considering that this is only a subset of data from an extremely small portion of Twitch’s streamers, it is crazy to imagine how many events like these occur on a daily, weekly, monthly, and yearly basis for all channels.
And for the database portion of statistics:
- 3,326,241 rows in the subscriptions table.
- 293,853 rows in the bits table.
- 389,236 rows in the deleted messages table.
- 1,864,142 rows in the mod actions table (Includes timeouts and bans).
- 19,904 rows in the raided table.
- 101,742 rows in the viewers table.
Presentation of Project
In addition to presenting the final version of my capstone project for the course, I decided to participate in the 18th annual Penn State Mont Alto Academic Festival on April 21, 2023. Which is an annual event that is held to allow students to present any academic work performed for that school year to fellow students, faculty, family, and the public.
There were 72 students across 26 projects that participated in the 2023 Academic Festival. These projects were broken down into their respective category:
- 15 Research Projects
- 9 Information Exhibits
- 2 Oral Presentations
I presented my project in the Information Exhibits category with the title of “Interactive Entertainment: A Peek into the World of Twitch”
Summarizing the project as: “This project involved the building of a three-tier architecture system, tasked with receiving, storing, and reporting a real-time feed from over four hundred streamers on Twitch, a live streaming platform. Live streaming platforms such as Twitch offer a variety of monetization features, which is what this project is tracking to gain a further understanding into.”
It was an interesting experience, and in the end I was glad that I participated in presenting my work. After the event was over, I was notified that I had won second place for my work in the Information Exhibits category.
More information related to the Academic Festival:
Penn State Mont Alto Academic Festival
Penn State Mont Alto 2023 Academic Festival
My Project & Poster for the 2023 Academic Festival
Official Penn State Announcement of Winners
My poster can also be seen here if is not available in the above links. As well as the official Academic Festival pamphlet.
I also have received this for placing second place at the Academic Festival.
Closing Thoughts
I believe that my Capstone Project was an overall success. I was able to achieve everything that I set out to do with this project and then some by adding additional features as it progressed.
(This post contains what I did to achieve my Capstone Project at the time. I may do things differently now or have changed things)